
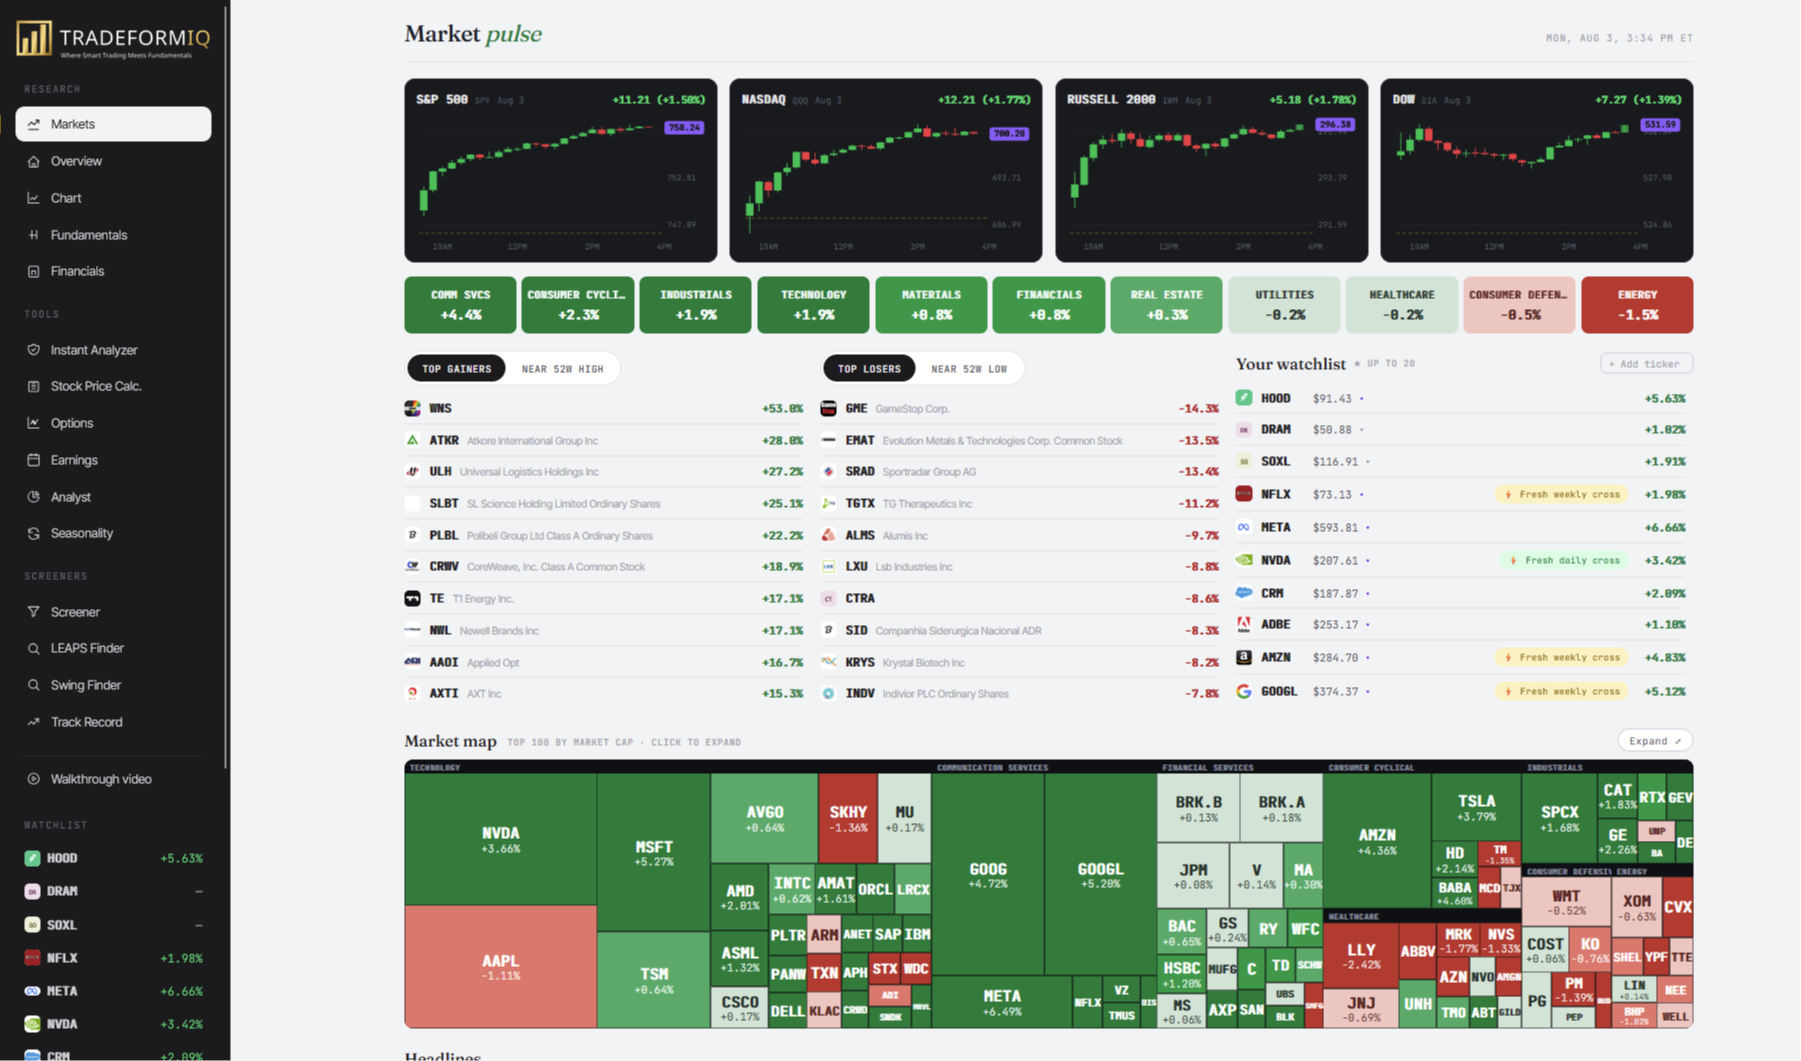
Every Stock. Every Angle.
One Dashboard.
Everything you need to size up any stock — in one clean dashboard. Less hunting, faster answers, clearer decisions.
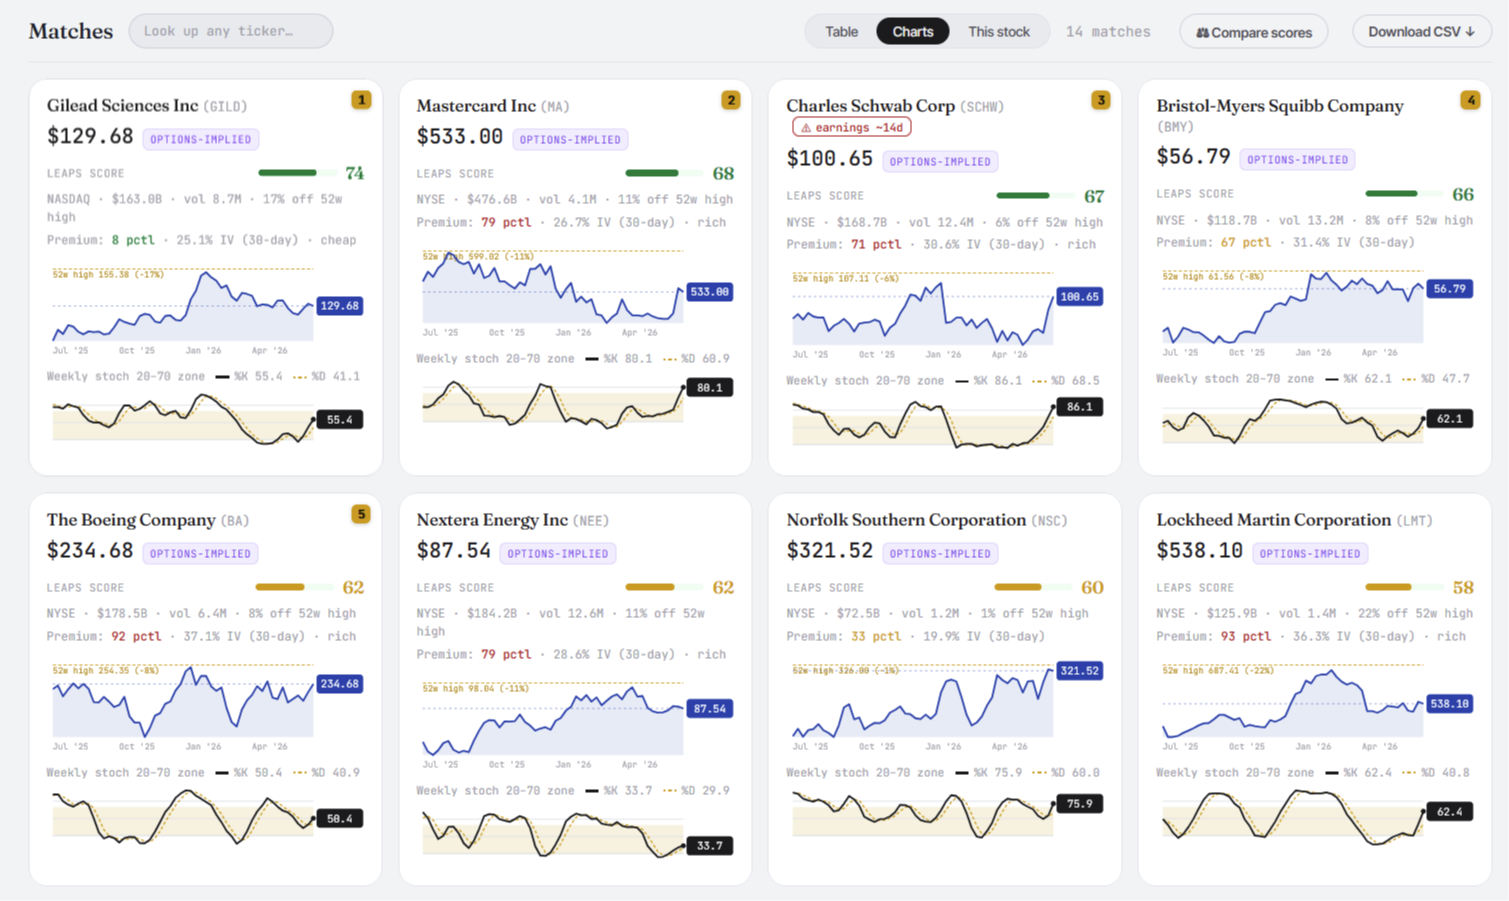
LEAPs Finder:
Stop hunting for setups
Finding a great long-term setup usually means combing hundreds of tickers by hand. The LEAPs Finder does it for you — every day it scans nearly 3,000 optionable stocks and scores each one on trend, timing, quality, and how cheap the options are right now. You just open the ranked list. Every signal it has ever produced is published inside.
Swing Finder:
The trades setting up this week
LEAPs are a slow game — sometimes you want the trade setting up this week. The Swing Finder scans the same 3,000 stocks on a daily stochastic and surfaces the ones turning up right now: fresh crosses, pullbacks inside an uptrend, clean breakouts. It also skips anything reporting earnings within two weeks, so you're not blindsided.
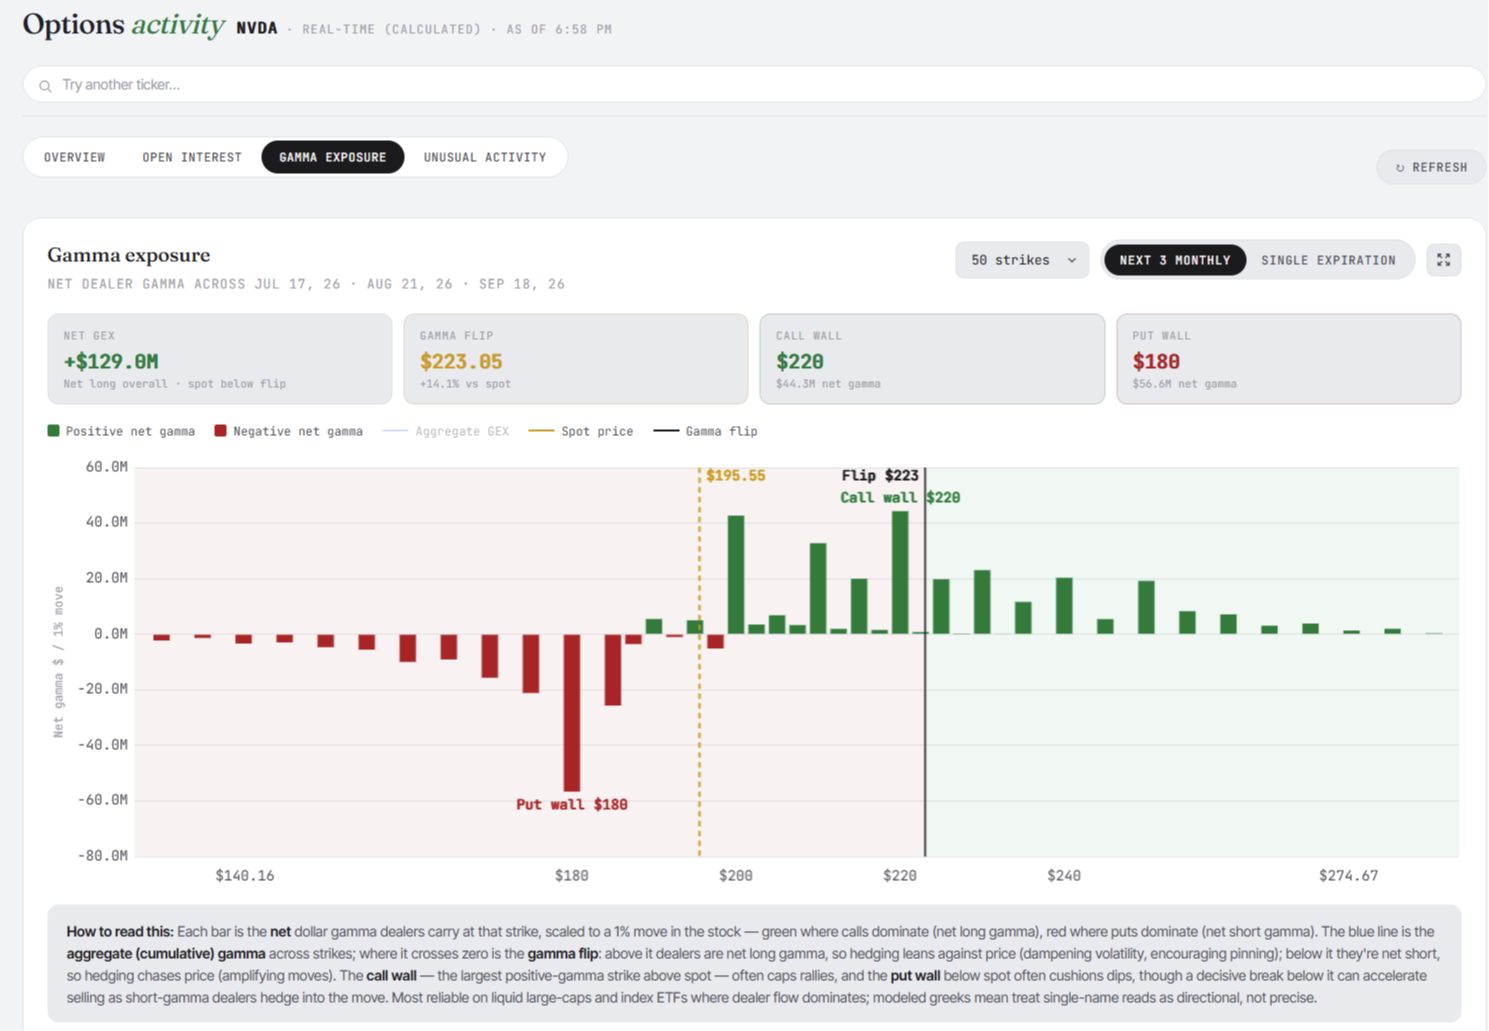
Options Data:
Read what the market is pricing in
Options data usually takes a pro to decode. Here it’s laid out plainly — live chains, implied volatility, put/call sentiment, and expected moves — so you can read what the market is pricing in without a finance degree.
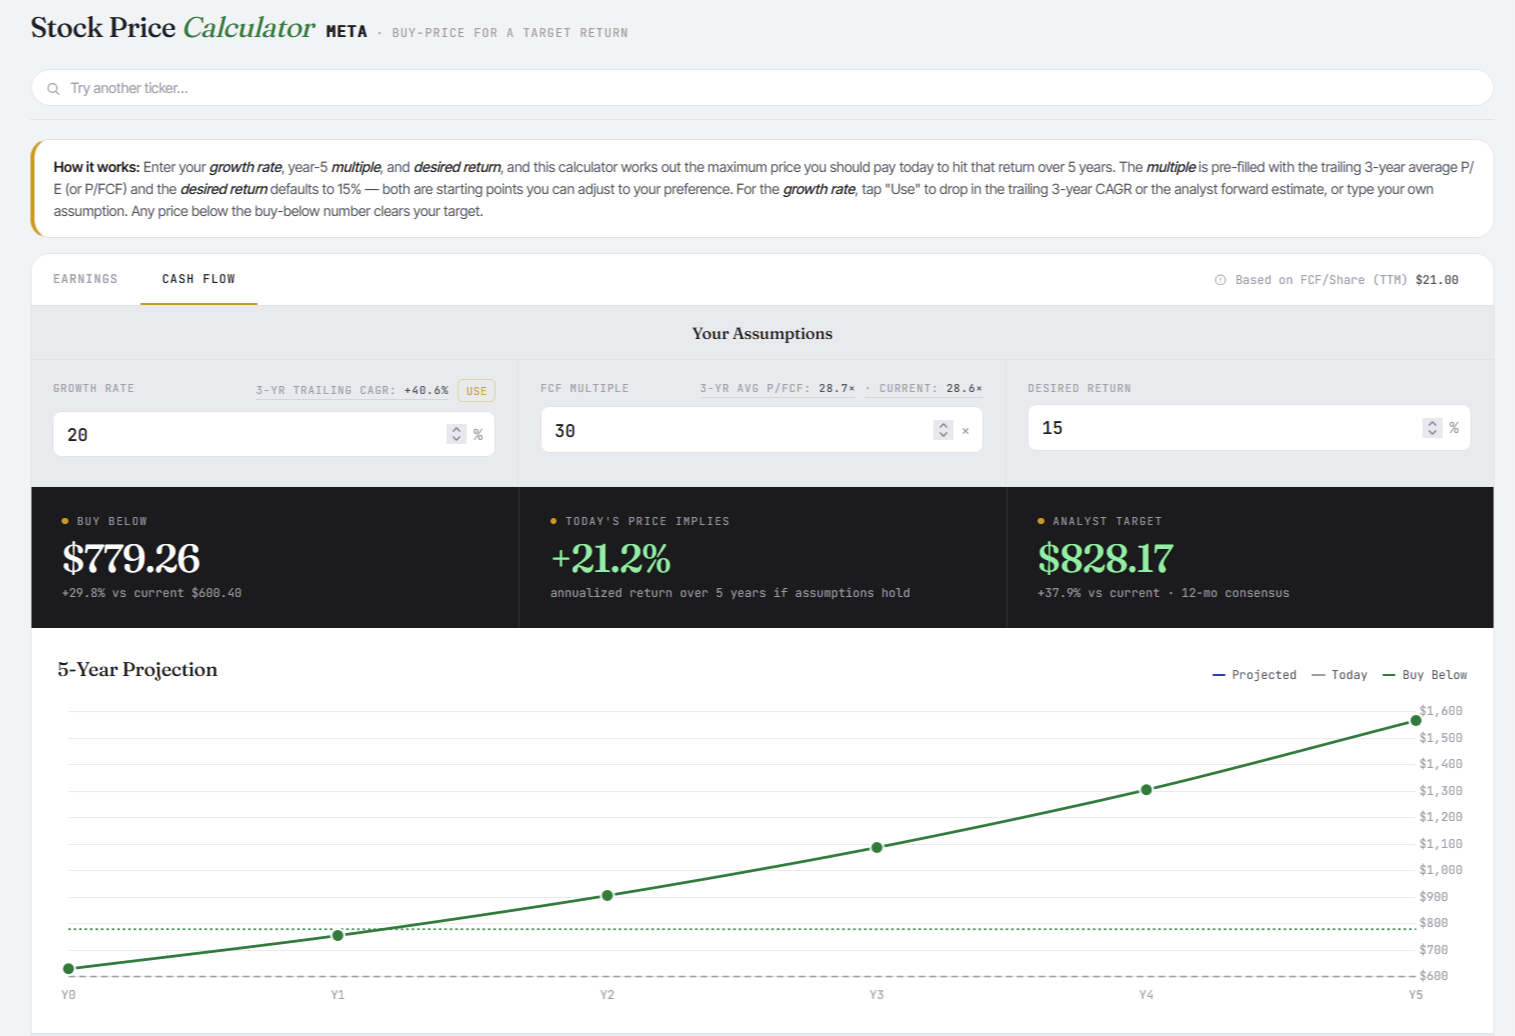
Stock Price Calculator:
Know your buy price before you buy
No more guessing whether a stock is a good buy. Enter the return you’re aiming for and it works backward from real fundamentals to the exact price the math calls for — so every entry starts with a plan instead of a hope.
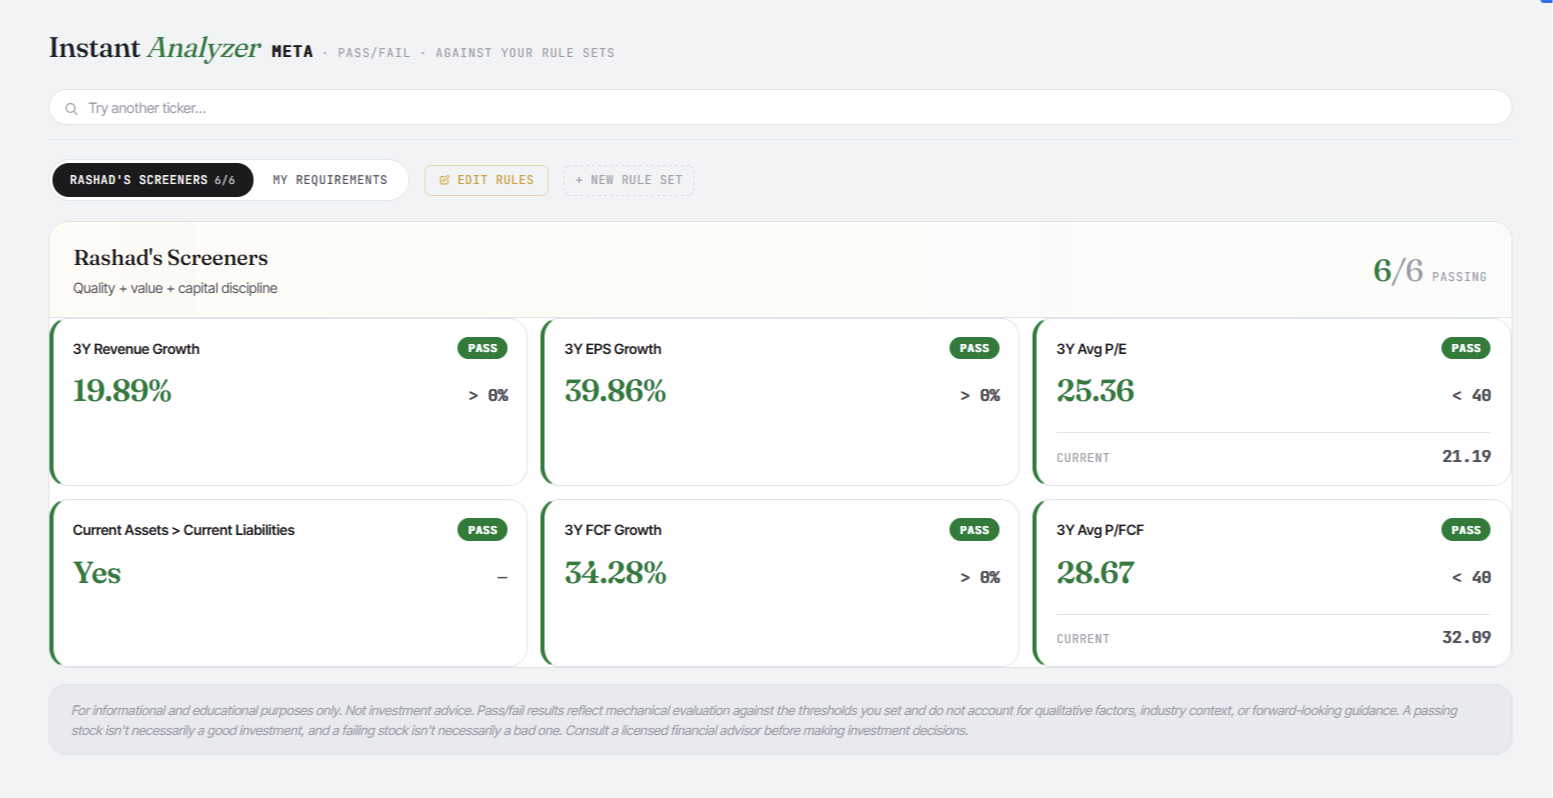
Instant Analyzer:
Your rules, checked automatically
Decide on a system, not a feeling. Set your own rules once — growth, valuation, margins, whatever matters to you — and every stock you pull up is instantly graded pass or fail against them. Your discipline, on autopilot.
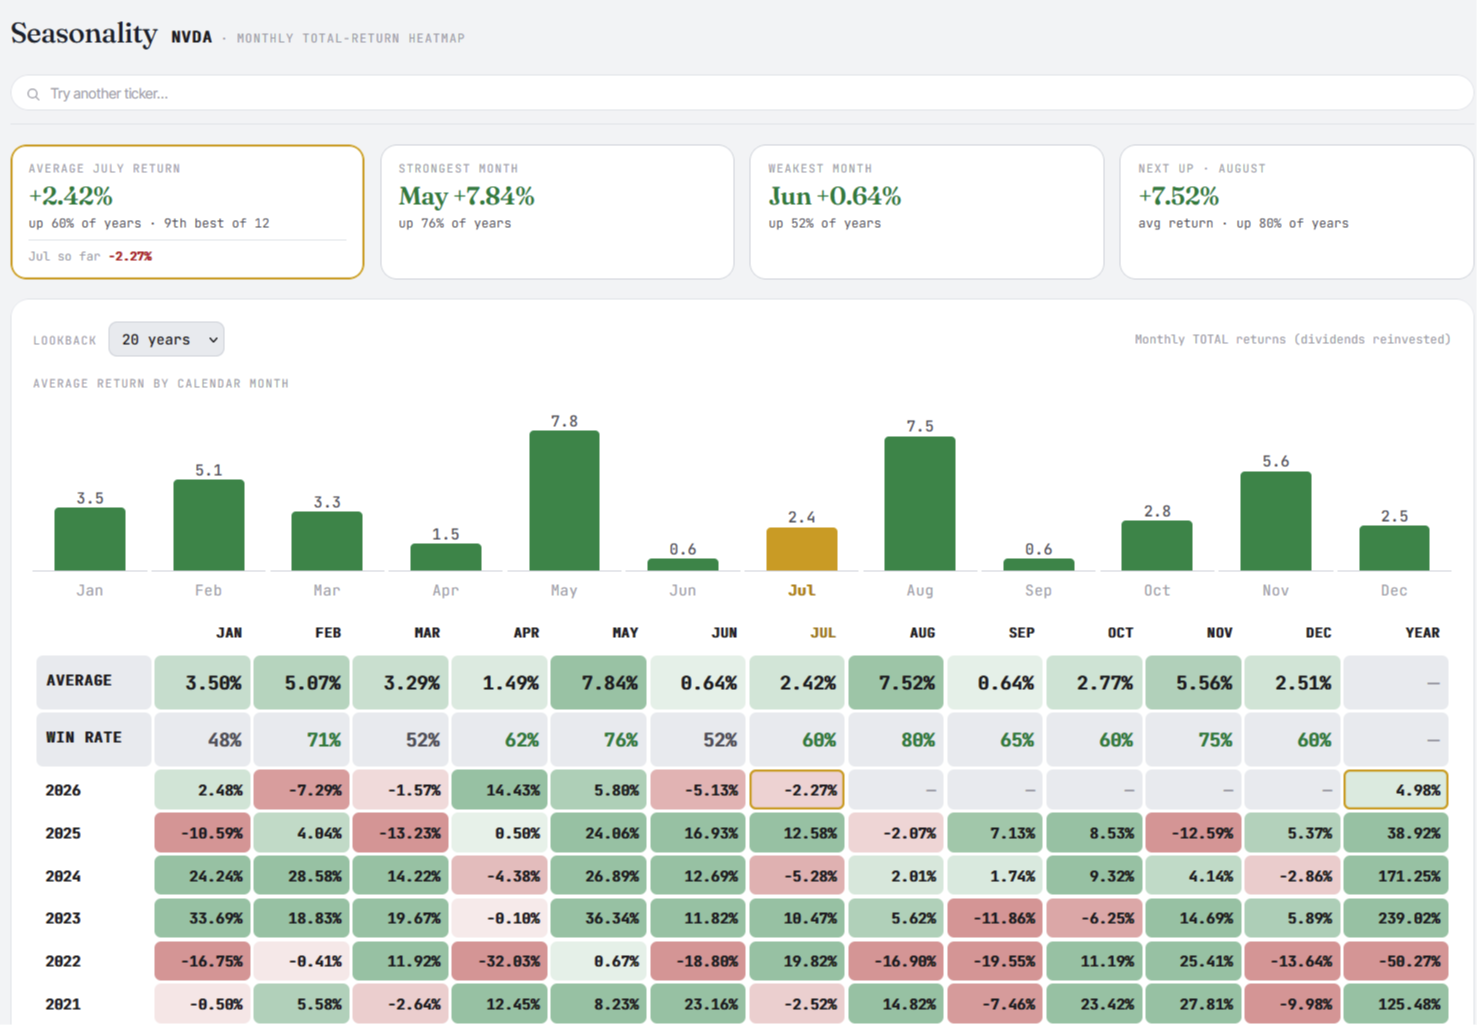
Seasonality:
Never enter blind to the calendar
History is one of the easiest edges to overlook. This turns up to 20 years of a stock’s monthly performance into a single heatmap — its strongest and weakest months, and how often each has historically finished green — so you never enter blind to the calendar.
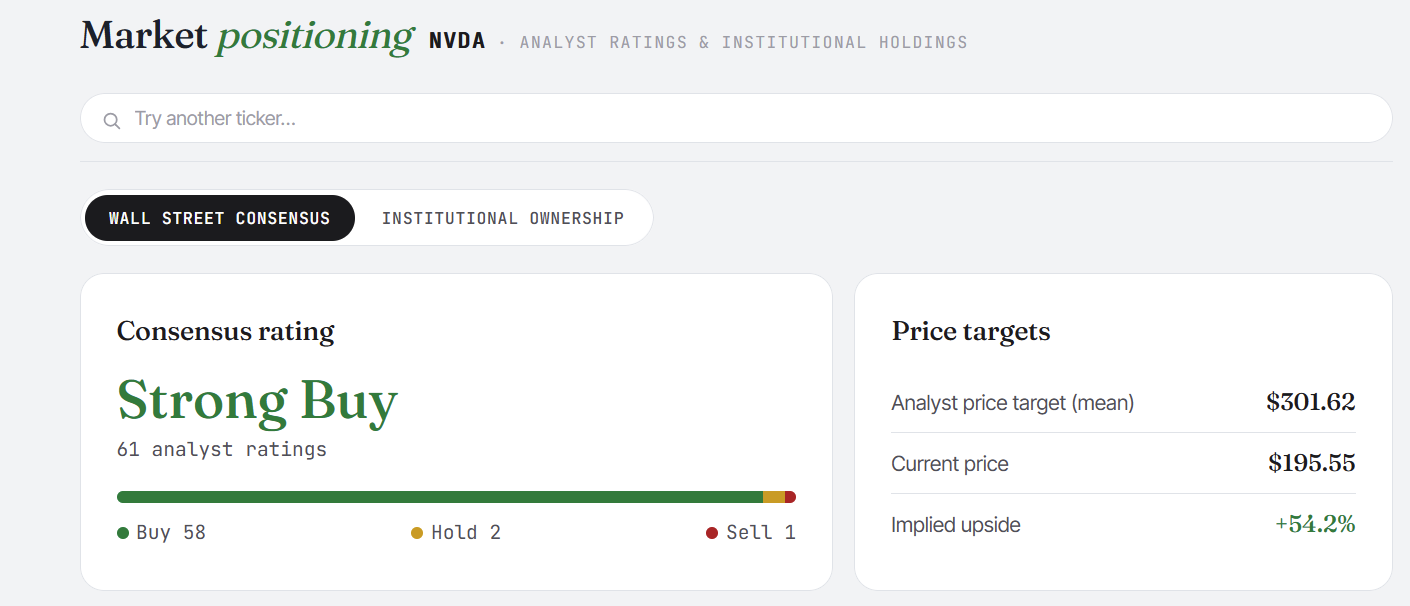
Analyst Price Targets:
Where Wall Street stands, one screen
See exactly where the pros stand without digging through a dozen reports — consensus rating, price targets, implied upside, and who’s been buying. The whole expectations picture, on one clean screen.
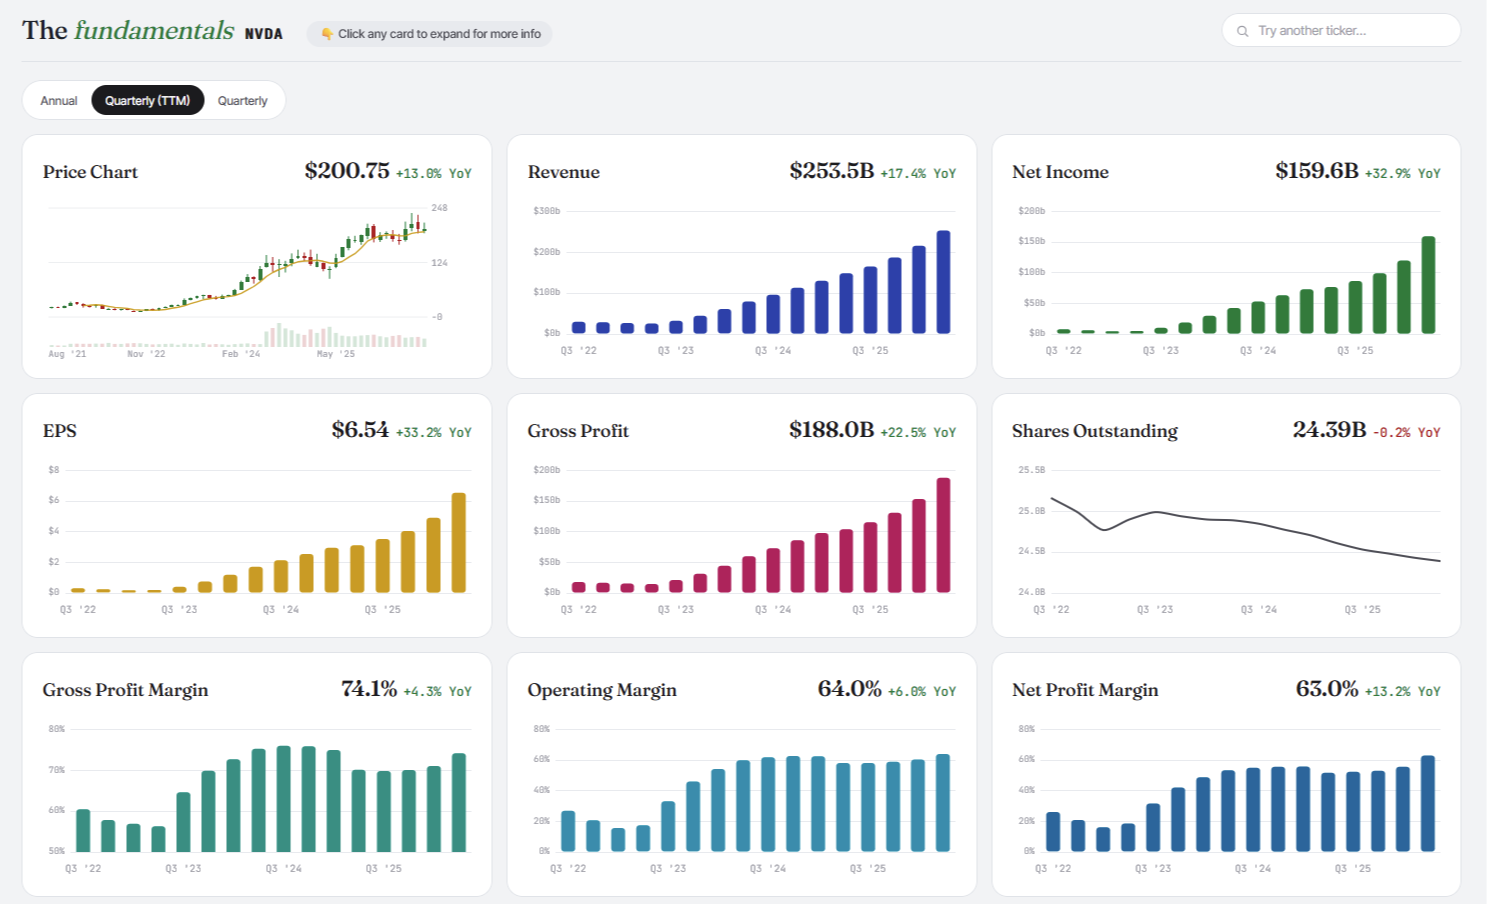
Visual Fundamentals:
Fifteen years of numbers, already charted
Checking a company's numbers usually means three browser tabs and a spreadsheet. Here fifteen years of revenue, margins, cash flow, debt and dividends are already charted — annual or quarterly, with any other ticker laid on top to compare. Click any card for the full history. The homework, already done.
Advanced Charting
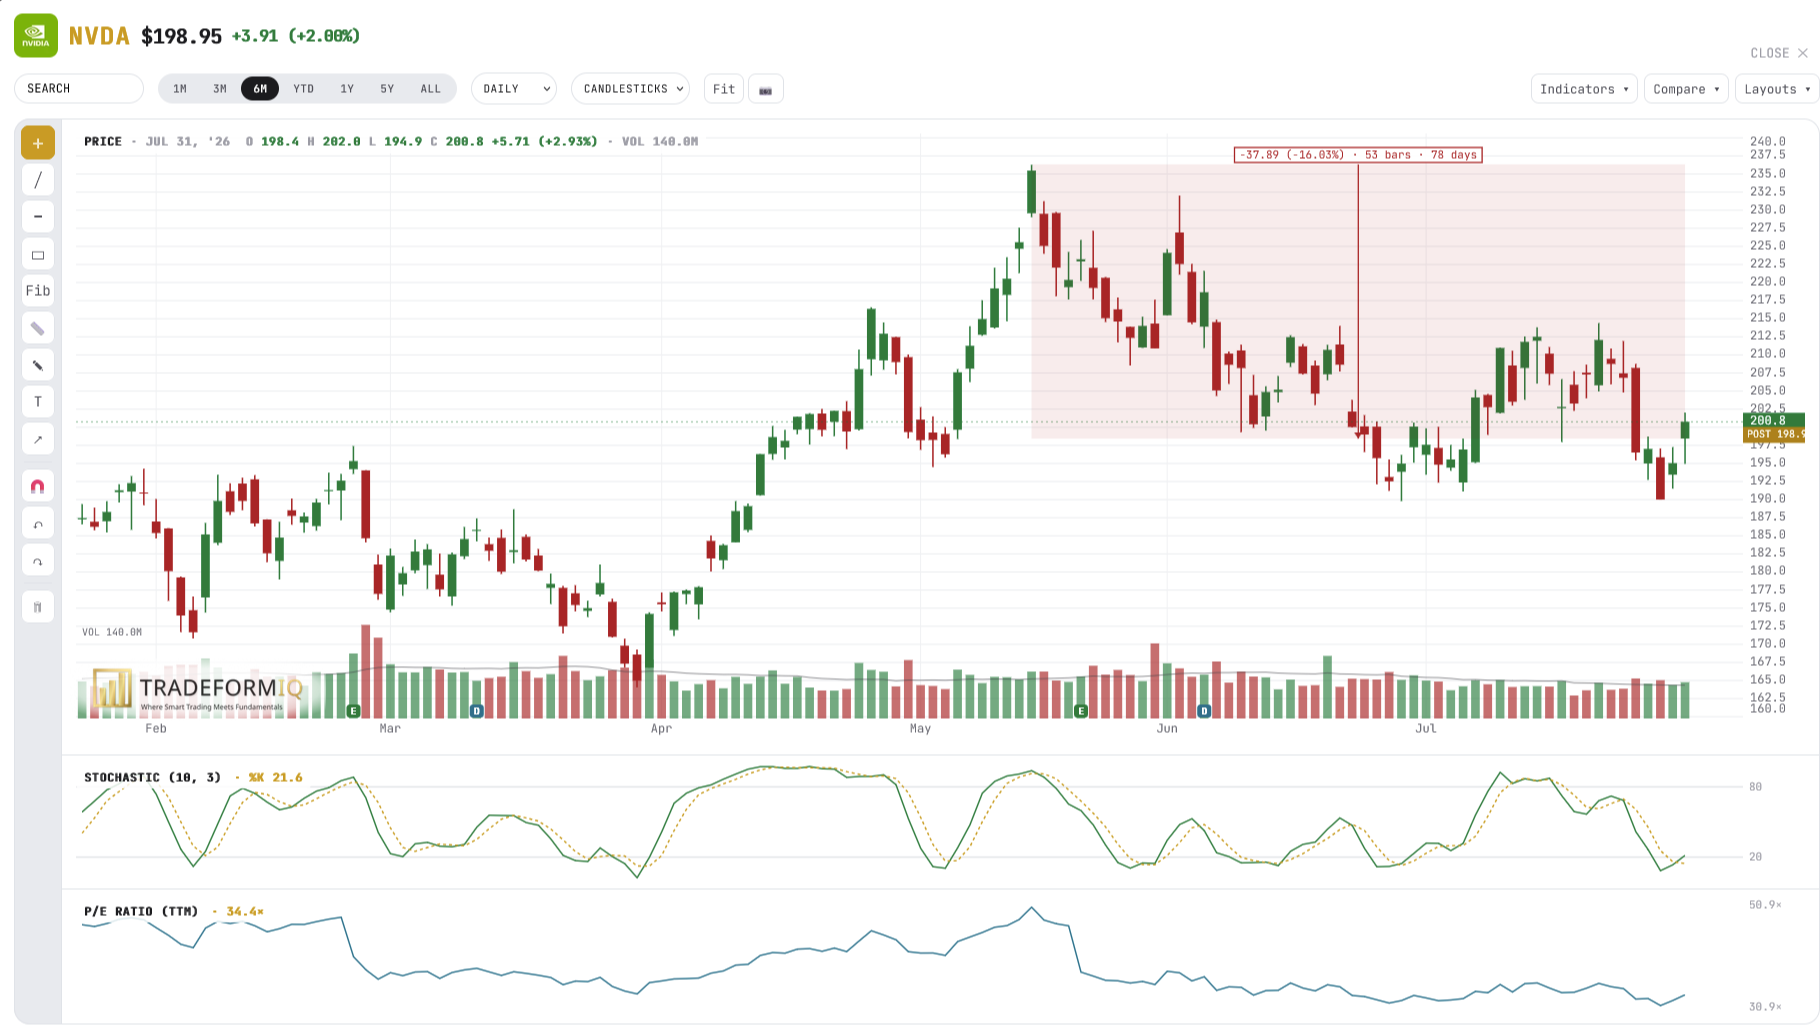
Most charts show you price and stop there. This one plots revenue, earnings and P/E right underneath the candles — alongside 35+ indicators, eight drawing tools, and every timeframe from five minutes to monthly. Your fundamentals and your chart, finally on the same screen.
Stock Screener:
Every listed stock, filtered instantly
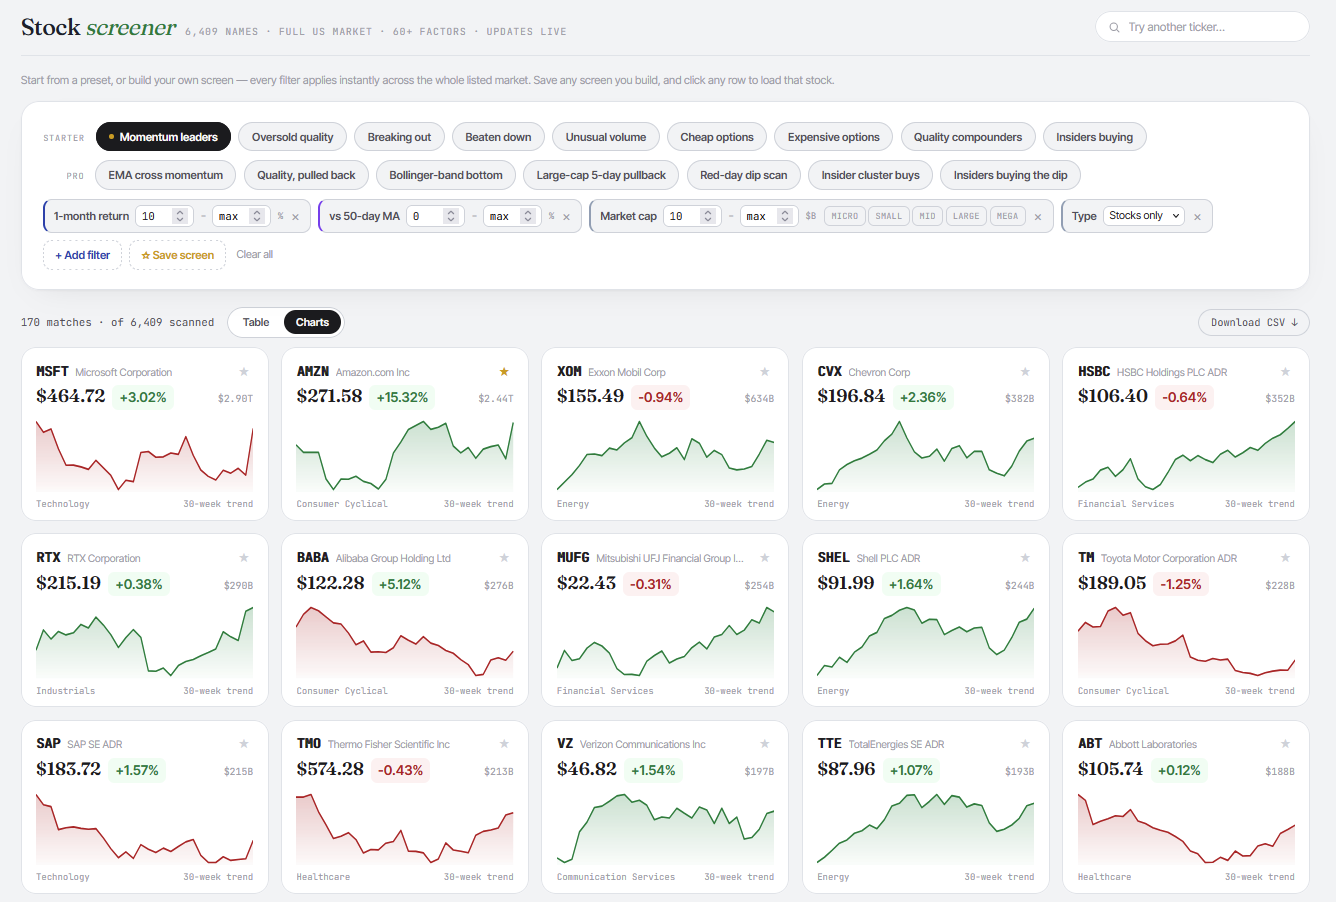
The stock you should be looking at is usually one you haven't thought of. Point it at all 6,800 listed U.S. companies, filter on anything from margins to insider buying, and the list narrows as fast as you can change your mind. Save the screens that work. Run them tomorrow.
The part nobody else shows you
We publish every signal the LEAPs Finder has ever produced.
Not the winners — every one. Rules, losses, drawdown, recalculated live each time you open the page. Nothing curated, because nothing is stored.
Dec 2024 → Jul 2026 · 300 round trips · figures as of 2 Aug 2026
Check our work
Every trade listed — entry, exit, return, and why it closed. Sort by biggest losses if you like.
Rules in plain English
Buy when momentum turns up from oversold. Sell when it turns back down. No black box.
Nothing hidden
A 52% win rate means half these trades lost. The worst lost 19.1%. Same screen as the return.
Cancel anytime.
Important: hypothetical backtested results — not a real trading account and not any investor's actual results. Trades are simulated at closing prices with no commissions, slippage or taxes, and measured on the underlying shares, not options. Backtests benefit from hindsight; past performance, hypothetical or actual, does not predict future returns. TradeForm IQ is a research and education platform and does not provide investment advice. See our Earnings Claims Disclosure.
Common Questions
Do I need to be an advanced trader or investor?
What do I actually get?
Where does the data come from?
Is this financial advice?
Can I cancel anytime?
Every Ticker. Every Angle. No More Guessing.
Get instant access and feel how much easier every decision gets when the price, the fundamentals, the chart, the options, and the day’s best setups all live on one screen.
Cancel anytime.
Get TradeForm IQ — Starting at $39.99/Month